Radiometric thermograms
Calibrated thermal images with embedded temperature data. Open in FLIR Tools, DJI Thermal Analysis or your preferred software and read absolute temperatures at any pixel.
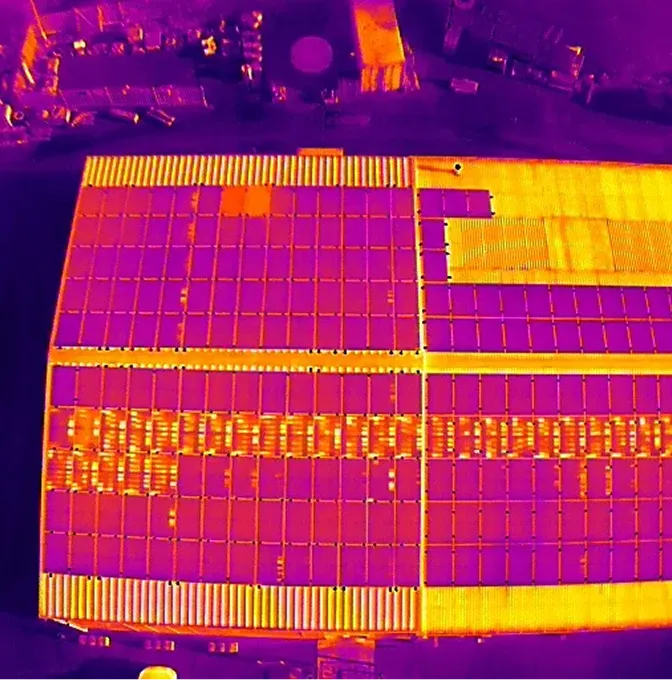
Drone-mounted thermal imaging that turns invisible heat signatures into actionable data — for solar farms, electrical infrastructure, building envelopes and industrial assets across Kenya.
A visual camera records what a surface looks like. A thermal camera records what it's doing. Hot spots on a solar array, overloaded conductors on a distribution board, moisture trapped behind cladding — none of these show up in a photograph, and all of them show up in a thermogram.
We fly radiometric thermal sensors alongside standard RGB cameras so every anomaly is located, measured and cross-referenced with a visual image. The output is a prioritised defect list your maintenance or engineering team can act on, not a folder of pretty heat maps.
Calibrated thermal data alongside visual imagery — packaged for the decision your team needs to make.
Calibrated thermal images with embedded temperature data. Open in FLIR Tools, DJI Thermal Analysis or your preferred software and read absolute temperatures at any pixel.
A stitched, map-accurate thermal layer showing the entire site in one view. Overlay it on the visual orthomosaic or your GIS to pinpoint anomalies by location.
High-resolution photos captured on the same flight, cross-referenced with the thermal data so every hot spot has a corresponding visual for context.
A structured report listing each anomaly with its location, temperature delta, severity classification, visual and thermal image pair, and recommended action.
Thermal capture is sensitive to conditions. The process is designed around getting clean data, not just flying the site.
We agree the assets, the question (defect screening, energy audit, moisture detection) and the environmental window — thermal surveys need the right solar load, ambient temperature and wind conditions to produce reliable data.
Thermal and RGB cameras fly the site simultaneously. Flight height, overlap and emissivity settings are chosen for the target surface and the resolution the analysis needs.
Radiometric data is processed, stitched where needed, and analysed against baseline temperatures. Anomalies are classified by type and severity.
The defect report, thermal ortho, raw radiometric files and cross-referenced visuals are delivered in a format your maintenance, engineering or energy team can act on immediately.
Any asset where failure generates heat before it generates a visible problem.
Panel-level screening for hot spots, bypass diode failures, cell damage, soiling and underperforming strings — covering thousands of panels in a single flight window.
Substations, switchgear, transformers and distribution lines. Overloaded connections and failing components show up as heat before they show up as outages.
Heat loss through walls, roofs, windows and insulation gaps. Useful for energy performance certificates, retrofit planning and post-construction QA.
Insulation failures, blockages, leaks and abnormal process temperatures on tanks, vessels, pipes and flare stacks — captured without shutting anything down.
Sensor choice depends on the resolution, the temperature range and the asset being inspected.
Dual-sensor platform with a 640×512 radiometric thermal camera and 48 MP visual camera. Our workhorse for solar, electrical and building envelope surveys.
Enterprise-grade thermal payload on the Matrice platform for larger sites, higher-altitude flights and industrial inspection requiring wider temperature ranges.
Centimetre-accurate positioning so every thermal anomaly maps to a real-world coordinate — essential when the report needs to direct a maintenance crew to the right panel or connection.
Post-processing software for radiometric analysis, emissivity adjustment, spot and area temperature measurement, and report generation from the raw thermal data.
We pair radiometric thermal cameras with the flight discipline of a survey operation — proper overlap, georeferencing and calibrated data. The result is a defect list, not a light show.
Practical answers for facility managers, solar O&M teams and building owners.
It depends on the asset. Solar panel inspections need high irradiance — typically late morning to early afternoon on a clear day with the array under full load. Building envelope surveys are best in the early morning before the sun heats external surfaces, or in the evening as they cool. We schedule around the conditions, not convenience.
A single flight window can screen 5,000–10,000 panels depending on array layout, flight height and overlap requirements. Large utility-scale farms are covered over multiple sorties across one or two days. Every panel gets a thermal and visual record.
On solar: hot spots, bypass diode failures, cracked cells, PID-affected modules, soiling and shading losses, underperforming strings. On electrical: overloaded connections, failing joints, unbalanced phases. On buildings: insulation gaps, moisture ingress, air leakage, thermal bridging. On industrial assets: insulation failure, blockages, leaks, abnormal process temperatures.
Calibrated. We fly radiometric sensors that embed absolute temperature values at every pixel. Emissivity, reflected temperature and atmospheric corrections are applied during processing. You can open the files in FLIR Tools or DJI Thermal Analysis and read real temperatures, not just colour gradients.
Both. Raw radiometric files and the thermal orthomosaic are delivered alongside a structured defect report. Each anomaly is listed with its location (GPS coordinates or panel ID), thermal image, visual image, temperature delta, severity classification and recommended action.
Yes. We often fly thermal and RGB simultaneously, and the same flight data can feed a thermal orthomosaic, a visual orthomosaic, a DTM and a 3D model. This is especially useful for solar farm as-builts and building assessments where you want geometry and thermal performance in one dataset.
Other things our team gets brought in for, often on the same projects.
We hold the regulatory approvals and supplier partnerships required to deliver compliant, audit-ready geospatial outcomes across East Africa.