Vegetation index maps
NDVI, NDRE, GNDVI and custom index maps showing crop vigour, stress zones and variability across the field.
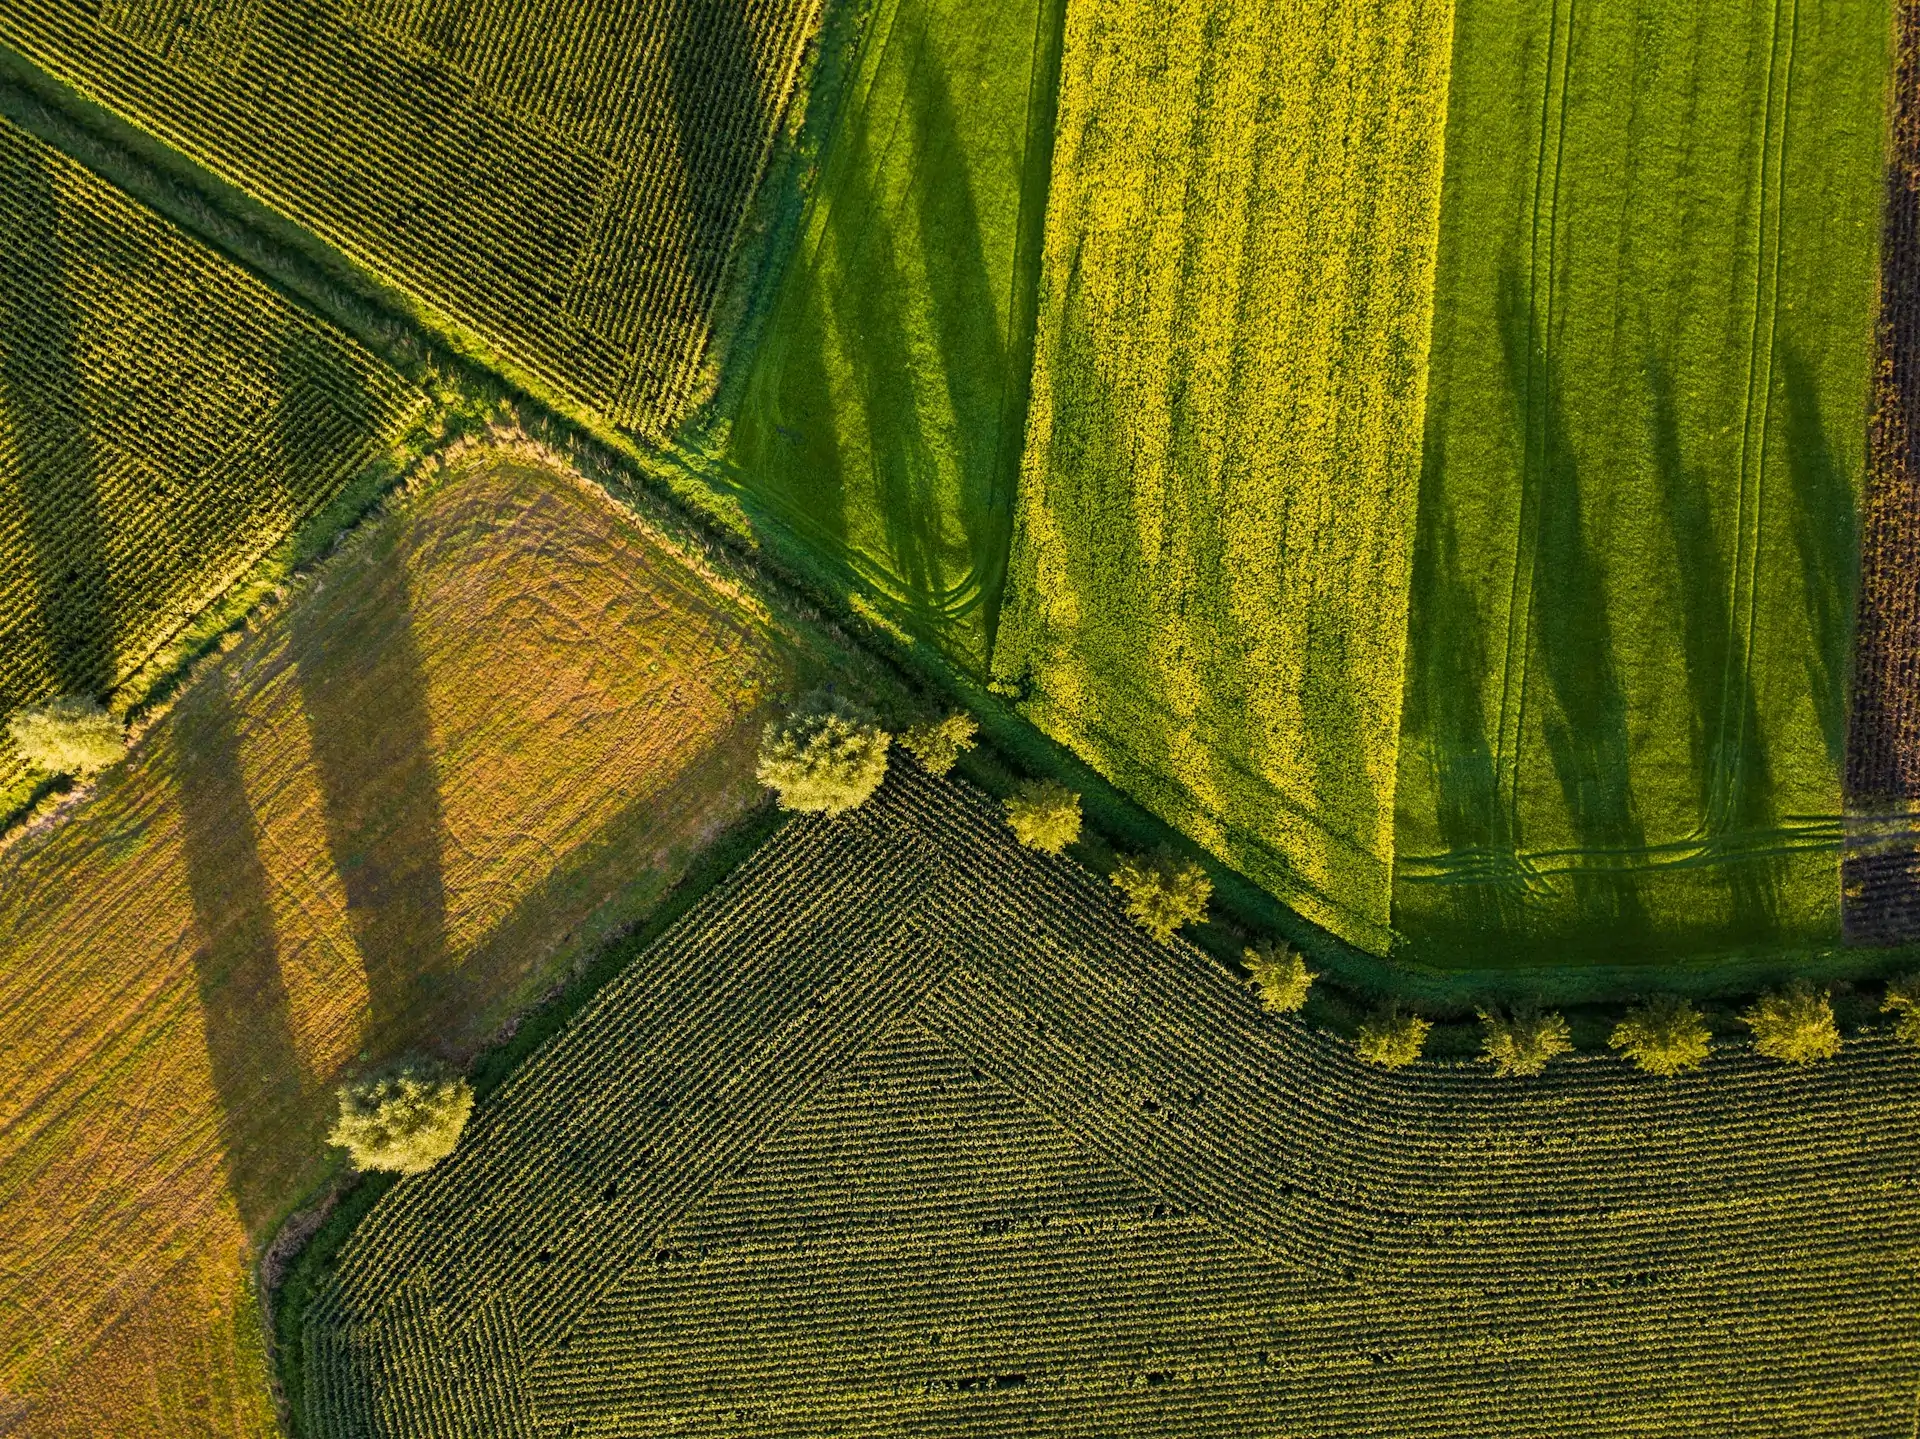
Multispectral drone surveys that map crop health, soil variability and irrigation performance — so agronomists and farm managers act on data, not guesswork.
The human eye sees green and calls it healthy. A multispectral sensor sees five or more bands and tells you where stress is building before the canopy shows it. We fly multispectral payloads over farms, estates and research plots, then process the imagery into vegetation indices — NDVI, NDRE, GNDVI — that map crop vigour, nutrient status and water stress at sub-metre resolution.
The output feeds directly into agronomic decisions: variable-rate fertiliser application, irrigation scheduling, pest scouting priorities and yield forecasting. We work with commercial farms, horticultural estates, tea and coffee plantations, research institutions and agricultural lenders across Kenya.
Data that talks to your agronomist, not just your GIS team.
NDVI, NDRE, GNDVI and custom index maps showing crop vigour, stress zones and variability across the field.
Annotated maps and zone summaries that highlight where intervention is needed — nutrition, water, pest scouting — with enough context for the farm manager.
A georeferenced visual base of the farm — useful for field boundary mapping, infrastructure planning and communication with landowners.
Repeat flights turned into a temporal record of crop development — track vigour trends, compare seasons and correlate with yield data.
Timing matters. We plan flights around growth stage, weather and the agronomic question being asked.
What crop, what growth stage, what decision the data needs to support — fertiliser, irrigation, pest management, yield.
Flights are timed to the crop calendar and weather. The multispectral payload captures visible and near-infrared bands at sub-metre resolution.
Imagery is calibrated, stitched and processed into vegetation indices. Zones of stress, vigour and variability are identified.
Maps and reports are delivered in formats the farm team can act on — printed zone maps, GeoTIFFs for precision application equipment, or dashboards for management.
Any crop, any scale — from a 10-acre trial plot to a 5,000-acre estate.
Crop health monitoring, variable-rate input planning and yield prediction for large-scale and export-oriented farms.
Canopy health assessment, replanting planning, irrigation efficiency and estate management.
Independent crop condition data for lenders, insurers and development programmes that need evidence of crop status.
The best vegetation index map is useless if the farm manager can't act on it. We deliver outputs that speak the agronomist's language — zones, priorities and actionable summaries.
Quick answers on what the technology does and what it costs to get started.
NDVI — Normalised Difference Vegetation Index — is a ratio of reflected near-infrared to red light. Healthy, photosynthetically active vegetation reflects strongly in near-infrared and absorbs red, so the index is high. Stressed, sparse or dead vegetation shows a lower value. We map this across your field so you see exactly where the crop is thriving and where it isn't.
Anything with a canopy — maize, wheat, rice, tea, coffee, sugarcane, horticultural crops, fruit orchards, timber plantations. The sensor doesn't care what the crop is; the interpretation layer changes depending on the species and growth stage.
It depends on the crop and the decision cycle. Annual crops might warrant two to four flights per season — early establishment, mid-season and pre-harvest. Perennial crops like tea or coffee often benefit from quarterly monitoring. We design the flight schedule around your agronomic calendar.
Yes. We export zone maps as shapefiles or GeoTIFFs that feed directly into variable-rate application controllers for fertiliser spreaders, sprayers and irrigation systems. If your equipment supports prescription maps, the data flows in.
Other things our team gets brought in for, often on the same projects.
We hold the regulatory approvals and supplier partnerships required to deliver compliant, audit-ready geospatial outcomes across East Africa.